

Ready to learn more about synchrotron IR? This page offers a more in-depth overview of the capabilities available through BSISB, as well as examples of their application to recent published works. Just click on each drop-down menu item below to learn more about that topic.
Synchrotron IR: A unique method for chemical imaging
Synchrotron infrared radiation (SIR) provides a range of advantages over conventional benchtop IR systems. By nature of its source, SIR has high coherence, high stability, high irradiance (brightness), and a wide spectral bandwidth ranging from the far- to near-infrared region of the electromagnetic spectrum. These qualities allow for rapid, high signal-to-noise sample analysis, so that SIR beamline users can conduct real-time chemical imaging at high spatial resolution.
Because the capabilities at BSISB can capture infrared spectra in spatial resolutions ranging from the nano to the micro, we also say that BSISB offers “multi-scale chemical imaging.” To capture nano-scale chemical information, we use a technique known as “near-field nanospectroscopy.” When working at the micron-scale, we are using “far-field spectromicroscopy.”
There are some drawbacks associated with synchrotron work. The biggest challenge is the limited amount of beamtime available, which must be equitably parceled out among users whose proposals pass the ALS peer-review process. To overcome this challenge, we have implemented autonomous data acquisition on all spectromicroscopy systems to increase their experimental efficiency, and we continue to actively collaborate with ALS infrared beamline staff to expand these capabilities over all infrared beamlines at the ALS.

Capabilities at ALS beamlines 1.4, 2.4, and 5.4
Beamline 1.4 offers infrared spectromicroscopy in the photon energy range of 0.03 eV (11,000 cm-1) to 1.40 eV (200 cm-1). The spatial resolution of 1.4 is diffraction-limited at 2-10 microns.
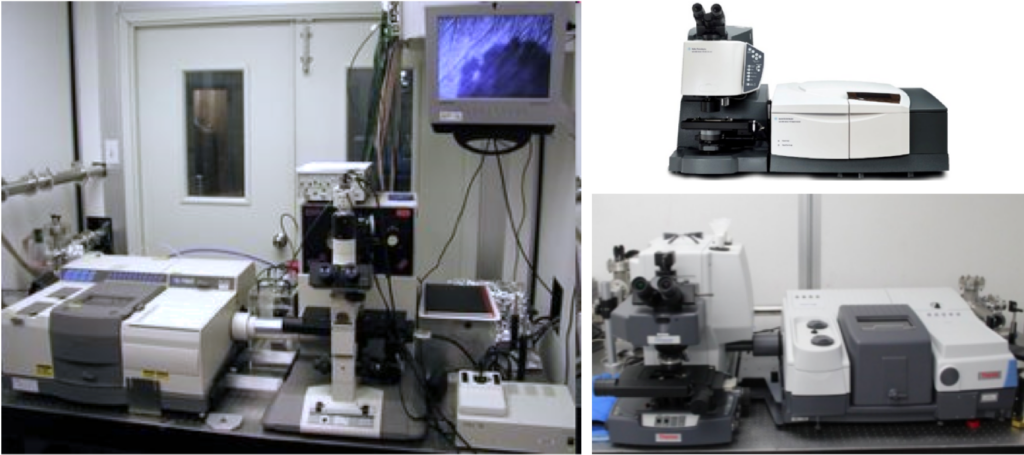
Beamline 2.4 is home to a synchrotron infrared nanospectroscopy (SINS) setup, in which a commercial atomic force microscope is coupled to the beamline. This allows the SINS setup to simultaneously capture spatially correlated SIR and atomic force microscopy (AFM) data at < 20 nm spatial resolution. Using only the SIR portion of the setup, this beamline also offers imaging. Laser-based near-field SIR imaging is available, as well. The photon energy range of 2.4 is 0.04 eV (4,000 cm-1) to 0.50 eV (300 cm-1).
Beamline 5.4 offers both SINS (Endstation 5.4.1) and microspectroscopy (Endstation 5.4.2) over the photon energy range of 0.03 eV (11,000 cm-1) to 1.40 eV (300 cm-1). Endstation 5.4.1 can achieve a sub-micron spatial resolution using a modified AFM system based on a home-built, near-field spectroscopy and imaging system. The resolution of 5.4.2 is diffraction-limited at 2-10 microns.
User access to all of these beamlines can be onsite or remote, in the latter case with the setup operated by BSISB/ALS staff. The ALS Beamline Directory offers a complete list of all capabilities available at the ALS.
Infrared spectromicroscopy
Also known as spectral microscopy, in infrared spectromicroscopy each “pixel” of the image is actually a full-range infrared spectrum. In this way, an image can be generated at a specific infrared wavenumber, allowing for side-by-side comparisons of different wavenumbers of interest to reveal, for example, the concentration of different functional groups or chemical compounds. The images are actually false-color maps that can be overlain on spatially coincident optical microscope images of the specimen.
With current technology, spectromicroscopy images can be captured over specimen dimensions ranging from millimeters to centimeters, with a diffraction-limited spatial resolution as fine as 2-10 microns. It’s important to remember that the capture time increases with both increasing specimen dimensions and finer sampling resolution. Because of the spatial range over which our systems can capture infrared data (the nano to milli range), we can create biochemical records of a whole cell — or carry out sub-cellular imaging to study specific cell features. We call this multiscale imaging. At BSISB, such fine resolution imaging can be achieved at Beamline 5.4, where both near-field and far-field capabilities exist.
Infrared spectromicroscopy is considered a label-free imaging technique because it relies on an intrinsic mechanism of infrared light absorption by the molecules in the experimental target. And unlike x-rays, which can break chemical bonds, infrared light only has enough energy to excite the natural vibration modes of bonds. The infrared light is absorbed during this process. As a result, infrared spectroscopy is a non-destructive technique for biochemical analysis. It’s also non-invasive, in the sense that whole cells or even tissue sections can be analyzed without the insertion of a probe.
A full SIR spectrum of a small region of sample can be captured within a fraction of a second using the systems available through the BSISB, because the infrared light supplied by the ALS is extremely bright (high irradiance). This is many times faster than a conventional benchtop IR system. Thus, by rapidly capturing back-to-back spectra, biochemical processes can essentially be captured in real time.

Synchrotron IR nanospectroscopy (SINS)
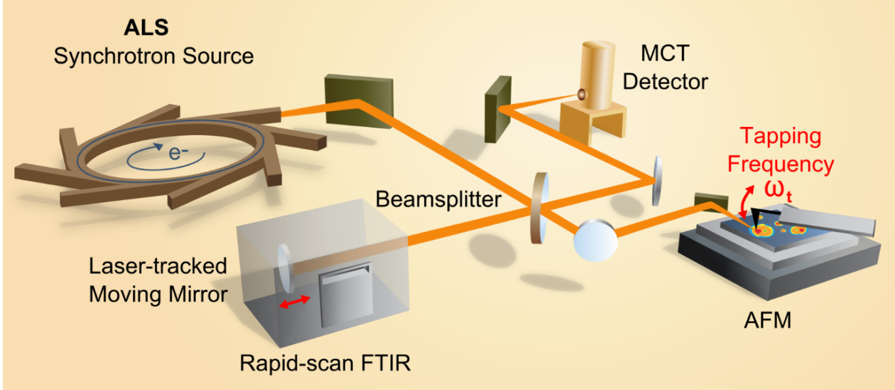
SINS provides broadband imaging and spectroscopy with nano-scale spatial resolution. Using a modified atomic force microscope (AFM) set up, a rapid-scan FTIR detector records infrared spectral data synchronously with the tapping AFM cantilever. This approach yields a tip-limited spatial resolution of the resulting infrared spectral map that is on the order of 20 nm and spatially congruent with the sample’s AFM record. Our system is set up to span the entire mid- and far-infrared regions.

Autonomous data acquisition
The biggest drawback to synchrotron infrared spectroscopy is the limited amount of time available to accommodate users from across the country, or even around the world. For this reason, BSISB has worked extensively with ALS staff to implement autonomous data acquisition on the spectromicroscopy setups at the ALS.
Autonomous data acquisition allows a user to quickly locate targets, and then spend time carefully analyzing those targets — instead of spending an extensive amount of time searching for targets. This approach has significantly reduced the time needed to analyze samples via spectromicroscopy. Although autonomous data acquisition is not available for nano-resolution SIR studies, BSISB is actively working to integrate this technology with the existing bi-modal chemical imaging setup, which incorporates spatially resolved mass spectrometry. The setup was commissioned in September 2022.
In the video below, Marcus Noack, LBNL CAMERA program lead and BSISB collaborator, explains the process of autonomous data acquisition. For further reading, consider Noack et al. (2021) or Holman et al. (2020).
Chemical imaging with mass spectrometry
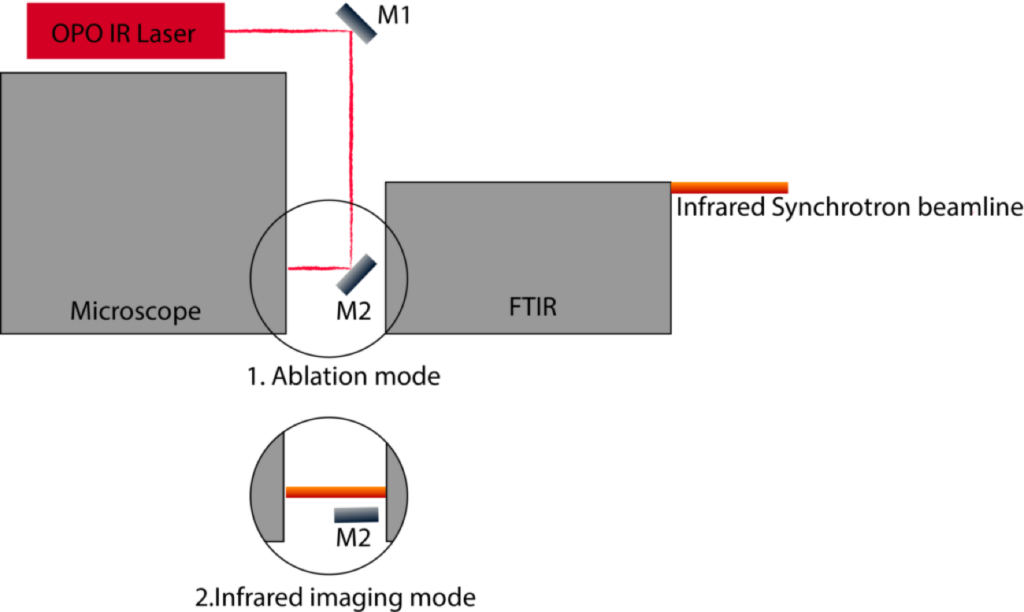
By coupling SIR spectroscopy with mass spectrometry, BSISB has developed a bi-modal chemical imaging technique known as AIRLAB-MS (ambient infrared laser ablation mass spectrometry). The combined setup permits the use of non-destructive SIR imaging to determine the region of interest and then uses laser ablation to evaporate the sample in that region, which is then characterized by mass spectrometry.
The AIRLAB-MS system is installed on the SIR microscope at beamline 1.4.4. This system design utilizes an OPO infrared laser to ablate the sample. The ablated plume of sample material is then caught by a liquid solvent droplet, which continuously flows to a macro-spray source that then ionizes the sample. The ions generated are identified by Q-TOF mass spectrometry. A motorized switch mirror allows the system to be rapidly flipped back and forth between SIR imaging and mass spectrometry through the same optical path in the microscope.

Real-time imaging of chemical events
Functional biological systems rely on chemistry taking place at the correct time and in the right place. Tracking the location and concentration of molecules over time is a key characterization step for biological investigations. Determining location and concentration is relatively easy if the molecule of interest is produced at high concentrations or distributed over large areas, but accurately characterizing small numbers of molecules produced by native or engineered biosystems remains a challenge for many researchers.
BSISB offers multiple capabilities at Beamline 1.4 to do precisely this. For example, we can fabricate microfluidic membrane devices to image biochemical processes in live cell cultures, while delivering nutrients to the cells to keep them alive and minimizing IR absorption from water. And while some systems may require more advanced experimental approaches, like the use of microfluidic devices to limit water absorption effects, many others require only highly standardized setups and approaches.

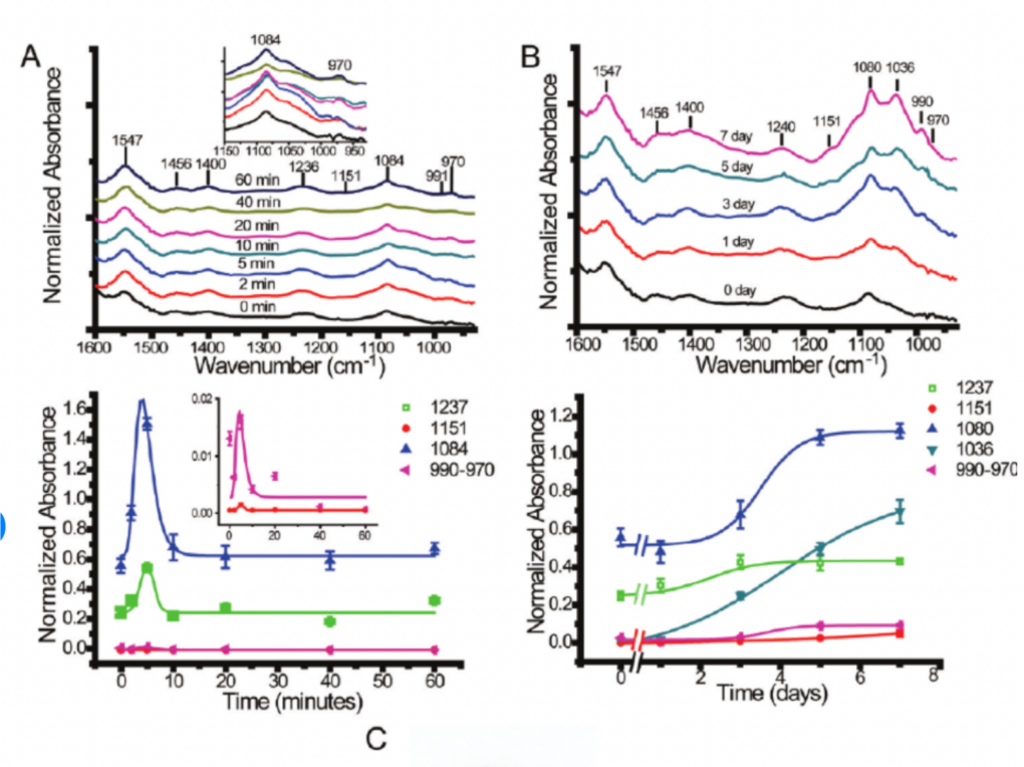
Above: Single-cell imaging to track protein phosphorylation events with live cells reveals spectral changes in the fingerprint region during PC12 cell differentiation. (Chen et al., 2012)
Left: Monitoring of biofilm development characteristics and adaptation based on the spatial and temporal distribution of mitomycin-C uptake in a 1 day old E. coli biofilm. (Holman et al., 2009)
Still curious? Learn more:
- Observations of molecular events that allow obligate anaerobes to survive sudden oxygen exposure (Holman et al., 2009)
- Gaining insight into the role of bacterial humic acid in polycyclic aromatic hydrocarbon degradation (Holman et al., 2002)
Microfluidics to circumvent water IR absorption
One of the major challenges with infrared spectroscopy is the broad range over which water absorbs infrared light. This absorption feature can be so strong that it obscures more subtle absorption features associated with target molecules of interest. To circumvent this dilemma, we collaborate with the LBNL Microfluidics Laboratory to develop customized microfluidics devices that can be incorporated into a user’s SIR work plan.

We are fully equipped to fabricate poly(dimethyl siloxane) (PDMS)-based microfluidic devices using the technique known as multi-layer soft lithography (MSL). An example is shown to the left.
We also have access to equipment needed to fabricate silicon, glass, glass-elastomer hybrid, and plastic microfluidic devices. Devices can also be fabricated in a closed-cell or open-cell design. Most fabrication steps are carried out in either a laminar flow hood or cleanroom.
